Scale - Build Your Framework
For the first principle of ABX measurement, scale, we'll dive into how to structure your data, how to capture key metrics, and best practices for data visualization.
© 2025 Folloze. ALL RIGHTS RESERVED.
Capture Key Metrics
Metric Definition
Total Accounts
Total accounts within your intended market segment size
will establish your targetable universe. Track using ABM
platform data from 6sense or Demandbase.
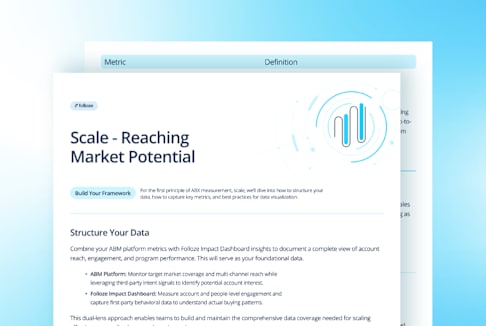
Structure Your Data
Combine your ABM platform metrics with Folloze Impact Dashboard insights to document a complete view of account
reach, engagement, and program performance. This will serve as your foundational data.
ABM Platform: Monitor target market coverage and multi-channel reach while
leveraging third-party intent signals to identify potential account interest
Folloze Impact Dashboard: Measure account and people-level engagement and
capture first-party behavioral data to understand actual buying patterns.
This dual-lens approach enables teams to build and maintain the comprehensive data coverage needed for scaling
effective, personalized account-based experiences.
Build Your Framework For the first principle of ABX measurement, scale, we’ll dive into how to structure your data, how to capture key metrics, and best practices for data visualization.
Scale - Reaching Market Potential
© 2025 Folloze. ALL RIGHTS RESERVED.
Metric Definition
Total Account Reach
Total unique accounts exposed to sales and marketing
activities measures outreach effectiveness across go-to-
market motions. Track using ABM platform data from
6sense or Demandbase.
Coverage Rate
The percentage of total accounts reached by your sales
and marketing activities provides consistent tracking as
segment sizes evolve or fluctuate.
Calculate using this formula = (# Total Accounts
Reached / # Total Accounts) * 100%.
Total Accounts Visited
Total unique accounts that had at least one person
engaged with your Folloze board(s), based on applied
filters, reveals account buying intent. Track using the
Folloze Impact Dashboard.
Total People Visited
Total unique people who engaged with your Folloze
board(s), based on the applied filters, reveals buyer
intent. If a person was invited, but did not land on board,
they will not be counted as engaged people. Track using
the Folloze Impact Dashboard.
© 2025 Folloze. ALL RIGHTS RESERVED.
Metric Definition
Average Coverage / Account
Average number of unique people per unique account
that visited your Folloze board(s), based on applied filters,
reveals how deeply you're connecting with accounts’
buying committee. Calculate using this formula = (# Total
People Visited / # Total Accounts Visited) * 100%.
Note: No ABM platform? Measure segment sizes through your CRM reports and account reach by tracking the number of unique accounts across all your go-to-market touch points.
Visualize Data
Simple charts transform complex ABX metrics into clear insights, enables teams to spot trends instantly, and make
data-driven decisions. By presenting performance data visually, teams can better communicate results across
departments, monitor KPIs in real-time, and tell compelling stories about program impact to stakeholders.