Engage - Quick Start Guide
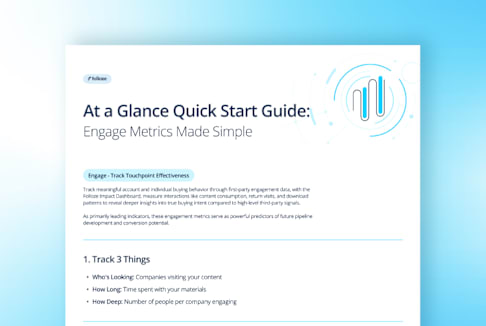
Access the "At a Glance Quick Start Guide" to track meaningful account and individual buying behavior through first-party engagement data, with the Folloze Impact Dashboard, measure interactions like content consumption, return visits, and download patterns to reveal deeper insights into true buying intent compared to high-level third-party signals.
© 2025 Folloze. ALL RIGHTS RESERVED.
2. Signs of Success
Hot Account = 3+ people from same company
Good Sign = 10+ minutes spent on content
Follow Up = Multiple visits in a week
1. Track 3 Things
Who's Looking: Companies visiting your conten
How Long: Time spent with your material
How Deep: Number of people per company engaging
3. Action Guide
Low Views → Improve your reac
Short Time → Update your conten
Few People → Expand your targeting
Engage - Track Touchpoint Effectiveness
Track meaningful account and individual buying behavior through first-party engagement data, with the Folloze Impact Dashboard, measure interactions like content consumption, return visits, and download patterns to reveal deeper insights into true buying intent compared to high-level third-party signals.
As primarily leading indicators, these engagement metrics serve as powerful predictors of future pipeline development and conversion potential.
At a Glance Quick Start Guide:
Engage Metrics Made Simple