Engage - Build Your Framework
For the second principle of ABX measurement, engage, we'll dive into how to structure your data, how to capture key metrics, and best practices for data visualization.
© 2025 Folloze. ALL RIGHTS RESERVED.
Capture Key Metrics
Metric Definition
Total Accounts Engaged
The number of unique accounts engaged with marketing
and sales activities measures engagement effectiveness
across go-to-market motions. Track using ABM platform
data from 6sense, Demandbase, or de-duplicated multi-
channel data.
Structure Your Data
Your ABX measurement framework combines two powerful data sources to give you a complete view of account
engagement:
ABM Platform: Tracks broad reach and basic interactions across marketing and sales channels (i.e.
email, paid media, etc.) - think of this as your "radar" showing which accounts are aware of your brand
Folloze Impact Dashboard: Measures deeper first-party account and buyer engagement behaviors -
this is your "microscope" revealing how seriously accounts are considering your solution.
Together, they help you understand both the breadth of your program reach and the depth of account and buyer
interest, enabling smarter targeting and follow-up decisions.
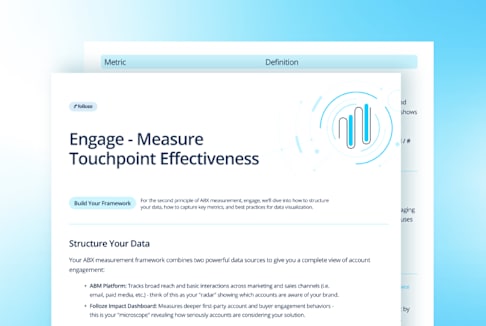
Build Your Framework For the second principle of ABX measurement, engage, we’ll dive into how to structure your data, how to capture key metrics, and best practices for data visualization.
Engage - Measure Touchpoint Effectiveness
© 2025 Folloze. ALL RIGHTS RESERVED.
Metric Definition
Engagement Rate
The percentage of accounts exposed to your sales ad
marketing activities that are taking action (i.e. click) shows
actual account interest vs view-only reach.
Calculate this formula = (# Total Accounts Engaged / #
Total Accounts Reached) * 100.
Total Accounts Engaged with Content
Total unique accounts with at least one person engaging
with content items, based on the applied filters, focuses
on progression from visitors to engagement.
Track using the .Folloze Impact Dashboard
Average Time on Content / Account (Hr / Mins / Secs)
The average is calculated by dividing the total time
people with account identification spent on content by
the number of accounts who viewed content items,
based on the applied filters. It’s the duration of content
interaction indicating depth of account interest and
buying intent.
Track using the . Folloze Impact Dashboard
Average Time on Content / Person (Hr / Mins / Secs)
The average is calculated by dividing the total time
people spent on content by the number of people who
viewed content items, based on the applied filters. It’s the
duration of content interaction indicating depth of
person interest and buying intent.
Track using the . Folloze Impact Dashboard
https://help.folloze.com/s/article/Organization-level-Impact-Dashboard https://help.folloze.com/s/article/Organization-level-Impact-Dashboard https://help.folloze.com/s/article/Organization-level-Impact-Dashboard
© 2025 Folloze. ALL RIGHTS RESERVED.
Account Engagement Score
The Folloze Account Engagement Score is calculated using a unique algorithm that looks at the intensity of activity
across the account, including content views, time on Folloze boards, interactions with content, high value actions, calls
to action, and tells you how far along they are in evaluating your platform or solution:
New - represents newly joined accounts
Initial - indicates the number of accounts that have shown interes
Growing - represents accounts that actively engaged with board
Active - reflects accounts that spent more time on the board
Surging - indicates the highest level of users who are evaluating Folloze
Lost Interest - accounts that previously qualified for an engagement level but have become inactive
due to decay or low engagement.
Use this score to streamline team actions and prioritize accounts that show the most promise. By understanding
content engagement in real-time, you can adjust your strategy and optimize content marketing with confidence.
Trigger actions to re-engage accounts that are declining in engagement so you don’t miss a beat. Automate next logical
actions based on account and individual behavior to drive more effective and efficient full-funnel motions. Track using
the . Folloze Impact Dashboard
Note: No ABM platform? Measure segment sizes through your CRM reports and account reach by tracking the number of unique accounts across all your go-to-market touch points.
https://help.folloze.com/s/article/Organization-level-Impact-Dashboard
© 2025 Folloze. ALL RIGHTS RESERVED.
Visualize Data
Data visualization transforms ABX metrics into actionable insights through intuitive charts. This visual approach helps
teams identify trends, track KPIs, and effectively communicate program impact to stakeholders across the organization.